|
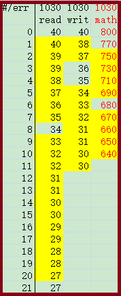
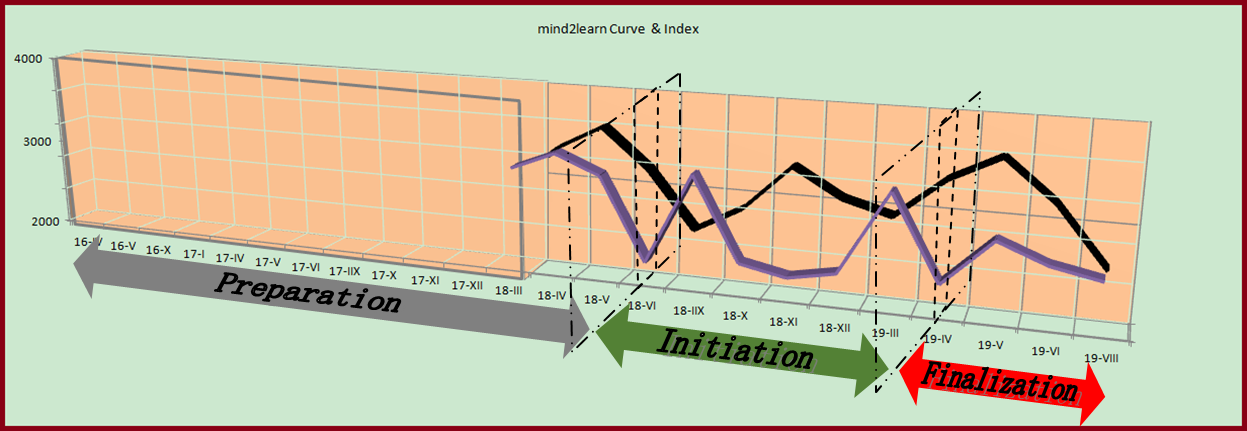
2019-08-24 SAT Curve August SAT was a recycled form of the June test. Some reported NAPA1030, others NAPA301. It was coded NAPA 1030 in June and recoded as NAPA301 in August. How did the curve look like? User data showed R-8/34, W-3/36;-4/35, and M-1/770;-2/750;-6/680. Here is my prediction of the curve through an extrapolation of the user reported data. It may not be accurate, but as much approximate as it can be. Scores with yellow background are extrapolated data. Going forward, what curve would it be in October? Let’s look at an updated curve-index chart. The purple line is the actual composite curve, while the black line is the mind2learn Curve Index. Harsh punitive curves were introduced in 2018-19 school year, leaving students of that year a 25% chance to like their tests. Beyond 2019, College Board has no form in stock that matches a good curve in terms of composite scores. Looked at this way, SAT will not present us any friendly curve and students shall plan not to take the test more than twice. If you have to take twice, your entire plan has to be adjusted to aiming at a super score but not a single one.
0 Comments
Your comment will be posted after it is approved.
Leave a Reply. |
The F‘LOGsthink, teach and enjoy Archives
November 2023
Categories |


 RSS Feed
